Published On Jun 25, 2019
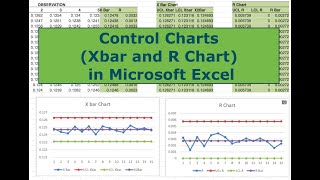
Learn how to create an Xbar and Standard Deviation (XbarS) control chart in Excel using this simple tutorial. This control chart is a commonly used tool for measuring variation of a process.
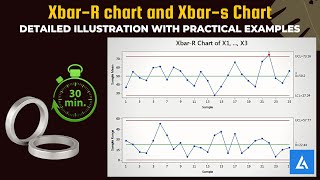
In this video, we'll show you how to create an XbarS control chart in Excel using simple steps. This control chart is a commonly used tool for measuring process variation, and is a great way to evaluate process control where sample size is greater than 10. After watching this video, you'll be able to create an XbarS control chart in Excel quickly and easily!
Control Charts are a great tool for engineering, business, and quality Engineers and other quality professionals. The most basic form of control charts are the Xbar and Standard Deviation (XbarS chart).
Power Query Download: https://www.microsoft.com/en-us/downl...
- - - - - - - - - - - - - - - - - - -
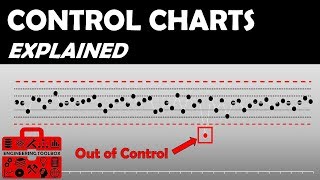
Full Playlist: • How do SPC control charts work?
- - - - - - - - - - - - - - - - - - -
Check out my channel for more videos and tutorials for engineers!
Like, follow, share and don't be afraid to drop me a comment/message with feedback, questions, or video suggestions!
Thanks for watching!
Channel Link: / @theengineeringtoolboxchannel
- - - - - - - - - - - - - - - - - - -
Other great content!
Desc: • EVERY Engineer Should Know About This...
- - - - - - - - - - - - - - - - - - -
Follow and interact!
Twitter: / theengtoolbox
Facebook: / theengineeringtoolbox
- - - - - - - - - - - - - - - - - - -
#ControlChart
#ExcelSPC
#ExcelForEngineers
#EngineeringToolbox
#EngineeringTutorials
#Engineering
#SPC
#SigSigma