Published On Jul 23, 2015
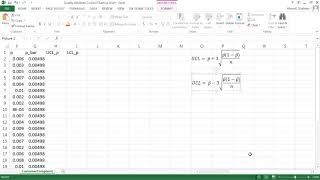
This video explains how to calculate centreline, lower control limit, and upper control limit for the p-chart. Equal and unequal sample sizes are discussed.
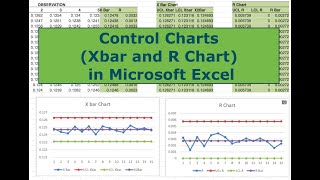
How to Construct a Control Chart in Excel:
• How to Construct a Control Chart in E...
See also
c-chart
• SPC 4: c - chart (Control Chart for n...
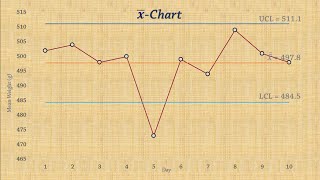
x-bar chart
• Statistical Process Control | Chart f...
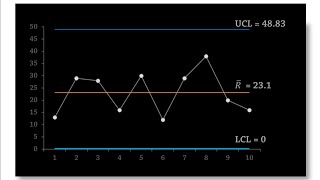
R-chart
• Statistical Process Control | R-Char...
show more