Published On Mar 29, 2023
CORRECTION: The value of A2 for n = 5 should be .577, not .557. This does affect the "how to" aspect of this video, but it will have a slight effect on the limits.
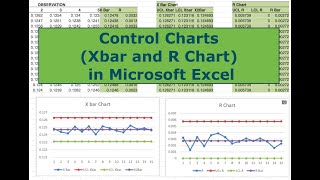
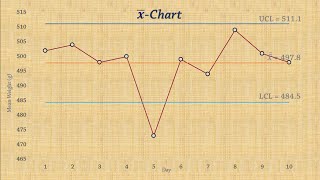
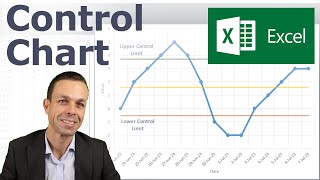
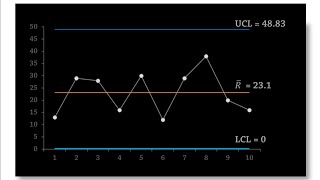
This video shows how to create X bar and R control charts in Excel. Control charts provide information about system processes.
Key words: control charts, Excel, x-bar, R
show more