Published On Oct 3, 2024
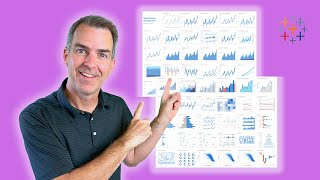
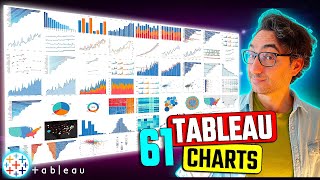
Time series visualization is always thought to be a line chart. This video is here to open your mind to 15 different options than a simple line chart that can help you get more out of your time series data.
👩🎓What You'll Learn:
How to build 15 different time series visualizations.
The strengths and use case of each visualization.
Downloadable workbook to learn from.
📊 Download the dashboard here: https://public.tableau.com/app/profil...
⌚Time Codes For Visualizations
00:20 - Percent of Total Bar Chart
02:21 - Stacked Area Chart
03:26 - Percent of Total Area Chart
04:28 - Bullet Chart
06:00 - Bar & Line
07:32 - Bar on Bar
08:35 - Variance to Average
10:12 - Difference from Previous
11:25 - Calendar Heatmap
13:31 - Sparklines, Bars, and Area
15:00 - Butterfly
16:39 - Bump Chart
18:22 - Enclosed Dot Plot
Videos I Think You’ll Want To Watch Next 👍
====================================
Tableau How To - Build a Header
• Tableau How To - Build a Header
Transform Your Tableau Dashboards from Meh to WOW! 3 Game-Changing Formatting Tips
• Transform Your Tableau Dashboards fro...
Follow Us
====================================
Subscribe for more great content: https://bit.ly/3JPgtUm
Linkedin
CDA: https://bit.ly/3PMazY1
August Severn: https://bit.ly/3pLxDvj
Alex Severn: https://bit.ly/3PNvMB0
Tableau Public
August Severn: https://tabsoft.co/43k3Rvo
Alex Severn: https://tabsoft.co/44RXkcP
#tableau #tableaupublic #tableauclasses #tableaudesktop #tableaututorial #tableauvisualization #CapitolDataAnalytics