Published On Feb 28, 2024
In this video, we're going to build 61 different charts in Tableau.
🔗 Course Links
Full Tableau Course: • Complete HR Tableau Project End-to-En...
Free Materials (Downloads): https://datawithbaraa.substack.com
☕ Stay connected
► Subscribe: http://bit.ly/3GiCVUE
► LinkedIn: / baraa-khatib-salkini
► Website: https://www.datawithbaraa.com
► Newsletter: https://bit.ly/BaraaNewsletter
► PayPal: https://paypal.me/baraasalkini?countr...
► Join: / @datawithbaraa
📚 Free Courses
✅ Tableau: • Complete HR Tableau Project End-to-En...
✅ Tableau Project: • Complete HR Tableau Project End-to-En...
✅ SQL Basics: • SQL Tutorial for Beginners [Ultimate ...
✅ SQL Advanced: • How I'd Learn Advanced SQL and Why (I...
✅ ChatGPT: • ChatGPT Tutorial for Beginners [Ultim...
🎓Other Platforms (Certifications)
Udemy: https://bit.ly/BaraaUdemy
Skillshare (1 Free Month): https://bit.ly/BaraaSkillshare
⭐ My favorite books: https://kit.co/DataWithBaraa/my-favor...
💻 My gear: https://kit.co/DataWithBaraa/my-deskt...
---------------------------------
⏱️ TIMESTAMPS ⏱️
---------------------------------
00:00:00 Introduction
00:00:32 #1 Row Bar Chart
00:01:30 #2 Column Bar Chart
00:02:32 #3 Side-By-Side Bar Chart
00:04:16 #4 Over Time Bar Chart
00:05:16 #5 Stacked Bar Chart
00:06:48 #6 Full 100% Stacked Bar Chart
00:07:49 #7 Multiple Small Bar Charts
00:10:36 #8 Bar-in-Bar Chart
00:12:48 #9 Barcode Chart
00:13:47 #10 Line Chart
00:14:47 #11 Customized Line Charts
00:17:23 #12 Multiple Lines Chart
00:18:57 #13 Dual-Lines Chart
00:20:03 #14 Cumulative Line Chart
00:21:47 #15 Multiple Small Line Charts
00:23:40 #16 Highlighted Line Chart (1)
00:24:54 #17 Highlighted Line Chart (2)
00:29:32 #18 Bump Chart
00:33:50 #19 Sparkline Chart
00:36:04 #20 Barbell Chart
00:41:02 #21 Rounded Bar Chart
00:42:48 #22 Slope Chart
00:46:35 #23 Bar & Line Chart (1)
00:47:31 #24 Bar & Line Chart (2)
00:49:16 #25 Bullet Chart
00:51:12 #26 Horizontal Lollipop Chart
00:54:34 #27 Vertical Lollipop Chart
00:55:56 #28 Area Chart
00:56:40 #29 Lined Area Chart
00:57:58 #30 Stacked Area Chart
00:58:41 #31 Full 100% Stacked Area Chart
00:59:53 #32 Multiple Small Area Charts
01:01:04 #33 Scatter Plot
01:02:23 #34 Customized Scatter Plot
01:04:26 #35 Dot Plot
01:05:53 #36 Circle Timeline
01:08:01 #37 Pie Chart
01:10:21 #38 Donut Chart
01:15:08 #39 Treemap
01:17:21 #40 Heatmap
01:18:47 #41 Bubble Chart
01:20:45 #42 Stacked Bubble Chart
01:22:37 #43 Basic Map
01:25:08 #44 Map with Symbol
01:26:08 #45 Map without Background
01:27:51 #46 Night Vision Map
01:31:20 #47 Histogram(1x Measure)
01:32:24 #48 Histogram(2x Measure)
01:34:27 #49 Calendar
01:36:58 #50 Waterfall Chart
01:39:20 #51 Pareto Chart (1)
01:42:50 #52 Pareto Chart (2)
01:47:10 #53 Butter Fly Chart (Tornado) (1)
01:50:17 #54 Butter Fly Chart (Tornado) (2)
01:53:20 #55 Quadrant Chart
02:00:33 #56 Box Plot
02:03:42 #57 KPI Chart
02:07:15 #58 KPI & Bar Chart
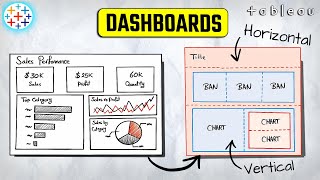
02:12:09 #59 BANs
02:15:03 #60 Funnel Chart
02:17:35 #61 Progress Bar
#tableau #data #analytics #datascience
*Please note I may earn a small commission for any purchase through these links, which means at no additional cost to you - Thanks for supporting the channel!*
*All opinions or statements in this video are my own and do not reflect the opinion of the company I work for or have ever worked for*