Published On Oct 18, 2014
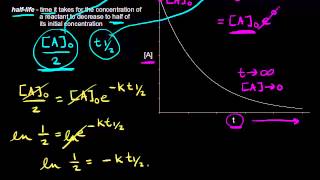
Example of graphing first-order rate data to see a linear relationship, and calculating rate constant k from the slope.
Watch the next lesson: https://www.khanacademy.org/science/c...
Missed the previous lesson? https://www.khanacademy.org/science/c...
Chemistry on Khan Academy: Did you know that everything is made out of chemicals? Chemistry is the study of matter: its composition, properties, and reactivity. This material roughly covers a first-year high school or college course, and a good understanding of algebra is helpful.
About Khan Academy: Khan Academy offers practice exercises, instructional videos, and a personalized learning dashboard that empower learners to study at their own pace in and outside of the classroom. We tackle math, science, computer programming, history, art history, economics, and more. Our math missions guide learners from kindergarten to calculus using state-of-the-art, adaptive technology that identifies strengths and learning gaps. We've also partnered with institutions like NASA, The Museum of Modern Art, The California Academy of Sciences, and MIT to offer specialized content.
For free. For everyone. Forever. #YouCanLearnAnything
Subscribe to Khan Academy’s Chemistry channel: / channel
Subscribe to Khan Academy: https://www.youtube.com/subscription_...