Published On Jul 10, 2024
Dashboard in Excel in Hindi .Download Practice Files from http://www.myelesson.org/downloads
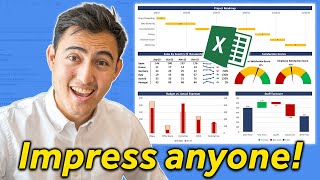
Dashboards in Excel offer several benefits that make them invaluable for data analysis and reporting:
1. **Data Visualization**: Dashboards provide a visual representation of complex data sets, making it easier to interpret trends, patterns, and outliers at a glance.
2. **Centralized Information**: They consolidate key metrics and data points from multiple sources into a single interface, providing a comprehensive view of the data.
3. **Interactivity**: Excel dashboards can be interactive, allowing users to filter data, drill down into details, or change parameters dynamically to explore different scenarios.
4. **Real-Time Updates**: If connected to live data sources or using Excel's data refresh capabilities, dashboards can reflect real-time changes, ensuring that decisions are based on up-to-date information.
5. **Customization**: Users can customize Excel dashboards to suit specific needs, adjusting layouts, colors, and charts to emphasize the most important insights.
6. **Communication**: Dashboards are effective tools for communicating findings and trends to stakeholders, managers, or clients in a clear and compelling manner.
7. **Automation**: Excel allows for the automation of data retrieval, calculation, and visualization, saving time and reducing the chance of errors associated with manual data handling.
8. **Integration**: Dashboards in Excel can integrate with other Microsoft Office applications and external data sources, enhancing their versatility and utility.
9. **Cost-Effective**: Compared to specialized BI tools, Excel dashboards are often more cost-effective, especially for small to medium-sized projects or organizations.
10. **Accessibility**: Excel is widely used and familiar to many users, making it accessible for a broad range of professionals without requiring extensive training in specialized software.
These benefits collectively make Excel dashboards a powerful tool for data-driven decision-making and analysis across various domains and industries.
** Useful Excel formulas and Functions **
10 Most Used Formulas MS Excel- • 10 Most Used Formulas MS Excel
Learn Basic Excel Skills For Beginners- • Learn Basic Excel Skills For Beginner...
Learn the Basic of Excel for Beginners - • Learn the Basic of Excel for Beginner...
10 Most Used Excel Formula- • 10 Most Used Excel Formula ☑️
Learn Vlookup Formula For Beginners in Excel- • Learn Vlookup Formula For Beginners i...
5 Excel Questions Asked in Job Interviews- • 5 Excel Questions Asked in Job Interv...
Create Speedometer Chart In Excel- • Create Speedometer Chart In Excel
Create Pareto Chart In Excel- • Create Pareto Chart In Excel
How to Create Dashboard in Excel- • How to Create Dashboard in Excel ☑️
Excel Interview Questions & Answers- • Excel Interview Questions & Answers ☑️
To watch more videos and download the files visit http://www.myelesson.org
Connect with us on Facebook - / excelmadeasy
Connect with us on Twitter - / excelmadeasy