Published On Dec 6, 2017
Hello Friends,
Here are the links for online courses with practical examples to understand Lean Six Sigma Concepts in Excel and Minitab:
MSA (Measurement System Analysis): https://bit.ly/3pjtUjo
Process Capability Analysis: https://bit.ly/2Mj5Nm7
7 QC (Basic Quality Control Tools): https://bit.ly/2Y7I770
Hypothesis Testing: https://bit.ly/2YchsWI
7 Advance Tools (Management & Planning Tools): https://bit.ly/3sML370
Correlation and Regression: https://bit.ly/3pjnn84
Control Chart- Powerful tool in data analysis: https://bit.ly/3c7Pgwn
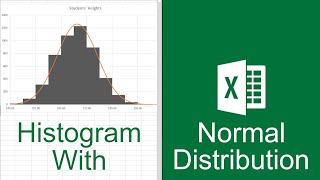
An analysis of the histogram is really tricky and explains many meaningful things from the collected data, and those things make this tool a very important tool.
Before drawing any conclusions from your histogram, satisfy yourself that the process was operating normally during the time period being studied.
If any unusual events affected the process during the time period of the histogram, your analysis of the histogram shape probably cannot be generalized to all time periods. Therefore, analyzing the meaning of the histogram’s shape is important, which I am going to explain in this video.
I am explaining all the distributions of histograms starting with Normal distribution, a Normality test to detect whether data is normal or not, and many other histogram shapes along with a description of “what they want to say?”
Everything is with practical examples and pictures which will be very easy to understand. I am sure you will enjoy it and it will make you a master in the interpretation of data.
We are committed to “Delight our customers beyond their satisfaction and change their lives in a positive way”.
As a part of it, we are providing the below services in Lean Six Sigma:
• Yellow Belt Online Training with Certification
• Green Belt Online Training with Certification
• Black Belt Online Training with Certification
• Detailed Minitab Training
• Mentoring and Coaching in Execution of Lean Six Sigma
You can visit our website at-
https://www.learnandapply.org/
And finally, thank you for watching…
#Histogram #HistogramExample #HistogramInExcel #HistogramInMinitab #QualityControlTools #QCTools #QCToolsWithExample #7QCTools #7QualityControlTools #QualityControlToolsWithExample #LeanSixSigma #SixSigma #InterpretationOfHistogram #HistogramInterpretation #HistogramProcedure #DifferentShapesHistogram