Published On Mar 24, 2016
Sign up for our Excel webinar, times added weekly: https://www.excelcampus.com/blueprint...
Checkout the full article and download the file at: http://www.excelcampus.com/pivot-tabl...
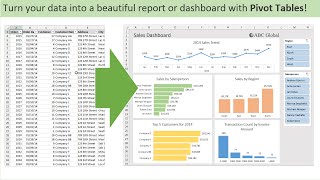
In this third part of the series we learn how to use Pivot Tables and formulas to analyze the multiple choice survey data. We also create a chart that shows the percentage of total responses for each item (choice) in the survey question.
Please subscribe to my free email newsletter to get more Excel tips and tutorials like this. http://www.excelcampus.com/newsletter
PART 2: • How to Analyze Survey Data Part 2 - U...
PART 3: • How to Analyze Survey Data Part 3 - S...
00:00 Introduction
00:41 Pivot Tab les
05:42 Conclusion
show more