Published On Aug 30, 2022
Control Chart or Shewhart chart, statistical process control chart (SPC).
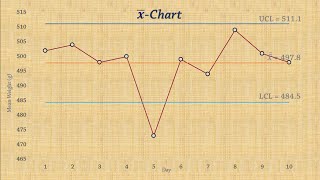
In this lesson we will create a quality control chart for individual measurements. For this x-chart, we will calculate the warning and control limits for a sample size of 5 and compare them with process capability requirements.
After this lesson, you should understand why the control limits of an x-chart for a sample size greater than one are different from those for a sample size exactly one.
You should also be able to use tables to calculate the warning and control limits for any sample size.
And you should know how the warning and control limits differ from the specification limits when a certain process capability is specified.
I wish you success,
Rolf Ihde
▬ Video Chapters ▬▬▬▬▬▬▬▬▬▬▬▬▬
00:00 - Learning Objectives
03:12 - Elements of a x-chart for n≥1 and differences to n=1
07:15 - Calculation of the 95% warning and 99% control limits
12:08 - control limits versus specification limits for process capabilities
15:15 - Key Messages