Published On Oct 3, 2022
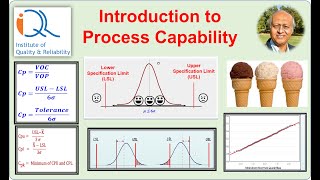
Learn how to calculate Pp, Cp, Ppk and Cpk. Understand why Cp and Cpk use sigma (as calculated from the average range) for the estimate of the variation, and why Pp and Ppk use the historical standard deviation. You will also learn how the following are true:
• If the Cp and Pp metrics are essentially the same, the process is operating the best it can since the process is in statistical control.
• If the Cp and Pp metrics are not the same, the process is out of statistical control.
• If all four metrics are essentially the same, the process is operating the best it can since the process is in statistical control and the process is operating at the center point of the specifications.
• If the metrics Cp and Pp are different from their counterparts, Cpk and Ppk, the process is not operating at the center of the specifications.
• If all four metrics are different, the process is out of statistical control and is not operating at the center point of the specifications.
Quickly get your own Performance Capability & Performance Metrics by downloading the free demo:
https://www.spcforexcel.com/spc-softw...
Keep learning about SPC from our 220+ acclaimed Knowledge Base articles:
https://www.spcforexcel.com/spc-knowl...
Get more in dept information about Process Capability and Performance Metrics from this SPC Knowledge Base Article:
https://www.spcforexcel.com/knowledge...
Support our Channel – Subscribe and Comment😊